仪表盘
仪表盘
仪表盘图的效果如下图所示:
图中指针指向的位置是当前的数值。
这种图表实质上和直角坐标图没有区别,只是把原来的横轴画成了圆形,横轴的值就标度在圆周上,纵轴的值用颜色涂在圆周上。需要注意的是图中的指针,指针的那条数据不能成为圆上的一种颜色,所以必须严格区分。
在润乾报表中,将需要作为指针位置的那条数据的纵轴对应值写为“value”,就可以被识别为指针位置。
上图的数据如下:
在这个示例中我们使用的是内建数据集ds1,其结构如下:
该报表的设计模板如下:
其中1和2行是不可视的。 下方的A3单元格中的统计图定义如下:
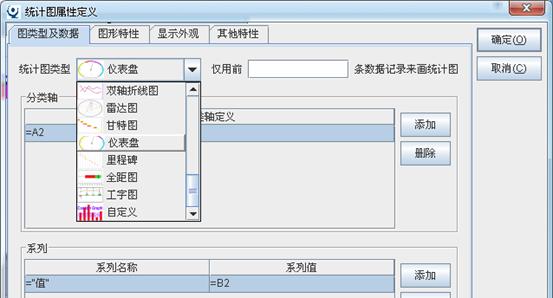
其中的分类轴和系列的设置与简单的二维图完全一样,分类轴即为圆周上刻度的定义,系列即为圆周上颜色的定义。
其他属性和选项无特别之处,与一般图表相同。